

The Board of Directors is the highest body that oversees the risks and opportunities related to climate change, supported by four committees:
1. The Corporate Governance and Sustainability Committee.
2. The Audit and Risk Committee.
3. Talent, Culture and Innovation Committee.
4. Finance and Investment Committee.

Seeks to harmonize the operations of GEB and its subsidiaries with the mitigation and adaptation objectives of the countries in which it operates.
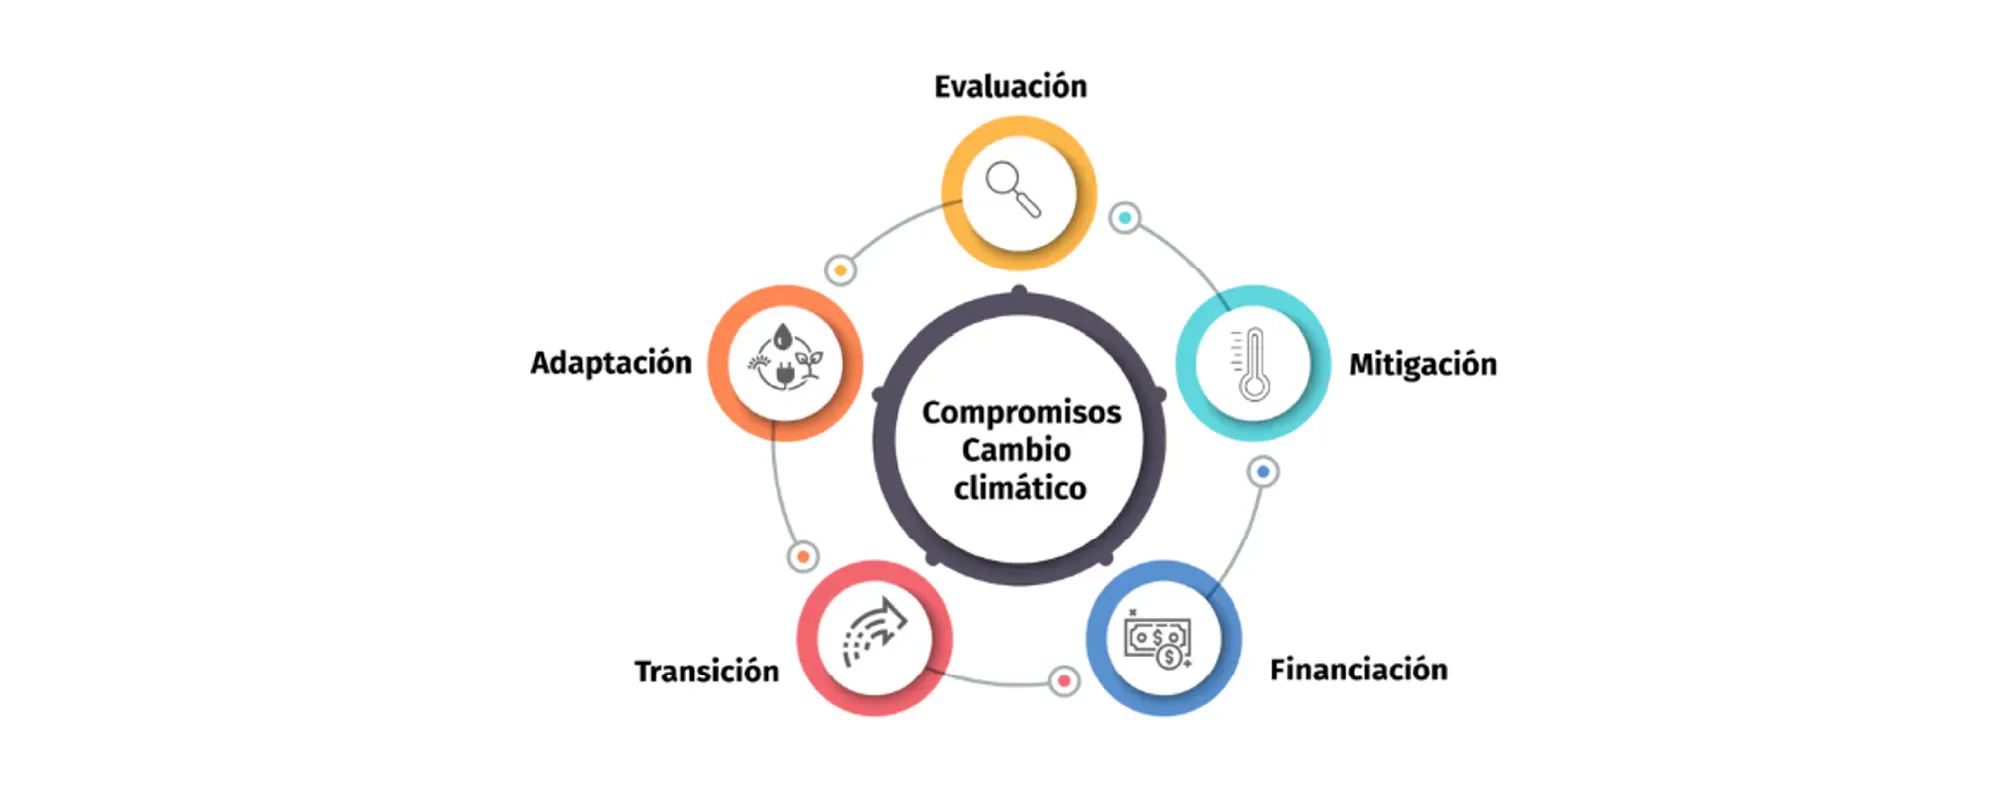
The Grupo Energía Bogotá measures and manages greenhouse gas (GHG) emissions in line with international standards, defines reduction pathways, prioritizes efficiency, and promotes innovative and cost‑efficient solutions.
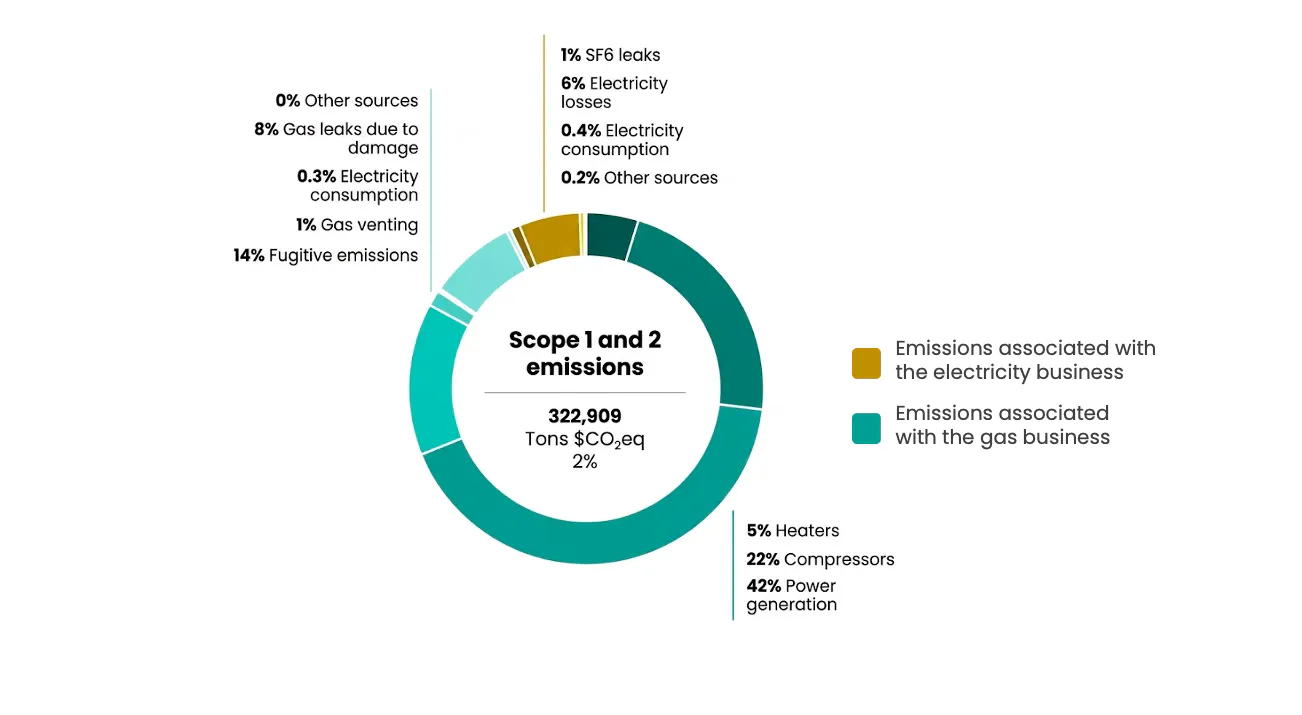
The following chart presents GEB’s Scope 1 and 2 emissions for 2025, including emergency-related emissions:
How is performance evaluated?
GEB monitors operational Scope 1 and 2 emissions by comparing them against the Business as Usual (BAU) scenario. This scenario represents the estimated emissions that would occur in the absence of mitigation measures, considering projected operational growth and historical emission trends. The target does not include emergency-related emissions.
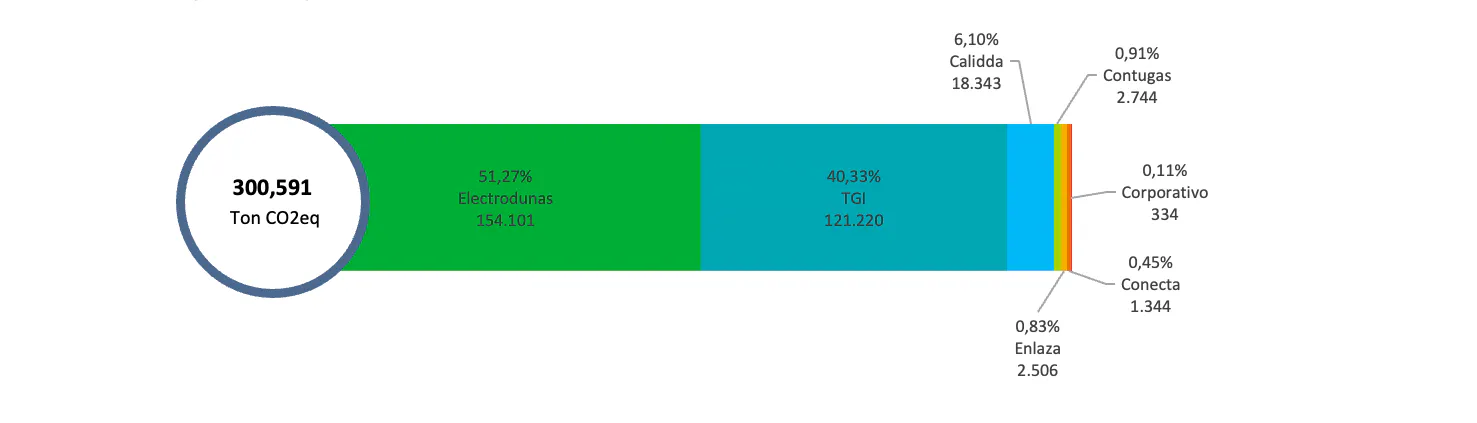
Emissions results by subsidiary, 2025
2025 emissions reduction target: 18%
The following table shows the historical Scope 1 and 2 emissions and the 2025 target
| Scope | Unit | 2022 | 2023 | 2024 | 2025 | Target for FY 2025 |
| Scope 1 (Total direct GHG emissions) | metric tonnes of CO2 equivalents | 312.430,53 | 452.094,91 | 316.160,35 | 302.850,23 | 322.063,47 |
| Scope 2 (Location-based) | metric tonnes of CO2 equivalents | 2013,34 | 24.161,73 | 19.366,86 | 20.058,57 | 21.331,11 |
In 2025, the Board of Directors set a target to reduce operational emissions (Scopes 1 and 2) by 18%, using the projected Business as Usual (BAU) scenario for that year as a baseline. By year-end, the Group’s operational emissions, excluding emergencies, totaled 300,591 tCO₂e, representing a 28% reduction compared to the 2025 BAU scenario (416,741 tCO₂e).
2030 | 2035 |
- 20% | -30% |
The adjustment of the targets reflects the Grupo Empresarial and its Board of Directors’ commitment to transparency with stakeholders. GEB will continue to identify and invest in cost‑efficient emission reduction initiatives.
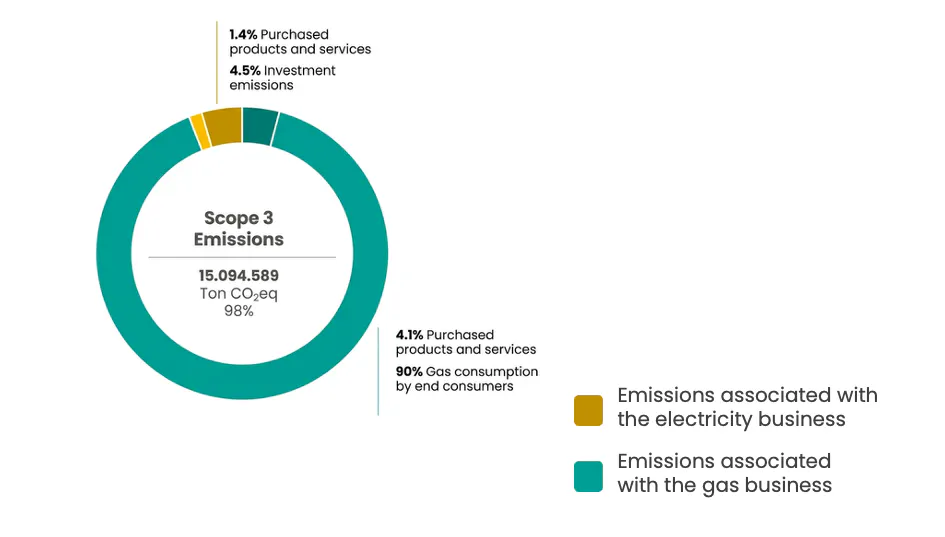
GEB, in addition to managing its Scope 1 and 2 emissions, continues to strengthen the measurement of Scope 3 by progressively incorporating new emission sources. In 2025, these emissions reached 15.09 million tCO₂e. The following chart highlights the main contributing sources.
Emission reduction initiatives
 | Repairing fugitive methane emissions, and switching from gas to electric compressors |
|
| SF6 gas leak management |
|
| Gas heater energy efficiency |
|
| Installation of photovoltaic systems for substation electricity consumption |

| Installation of solar panels for office electricity consumption |
|
| Efficiency in In-Line Inspections (ILI) |
Emissions Verification
Verifying the emissions inventory is fundamental because it guarantees the accuracy and credibility of the reported data. This verification ensures compliance with the ISO 14064 standard and strengthens transparency with investors, clients, and other stakeholders. Having validated information enables more effective decision-making to reduce emissions and advance sustainability commitments.
Verification of Scopes 1, 2 and 3 for 2024
• GHG Verification Statement, GEB, 2024.
• GHG Verification Statement, Enlaza, 2024.
• GHG Verification Statement, TGI, 2024.
• GHG Verification Statement, Calidda, 2024.
• GHG Verification Statement, Contugas, 2024
• GHG Verification Statement, Electrodunas, 2024
• GHG Verification Statement Conecta 2024
Verification of Scopes 1, 2 and 3 for 2025
The GEB is working on the design of adaptation measures to operate the infrastructure under extreme weather conditions. In 2024, it began assessing the vulnerability of the infrastructure and defining adaptation plans for Enlaza and TGI.
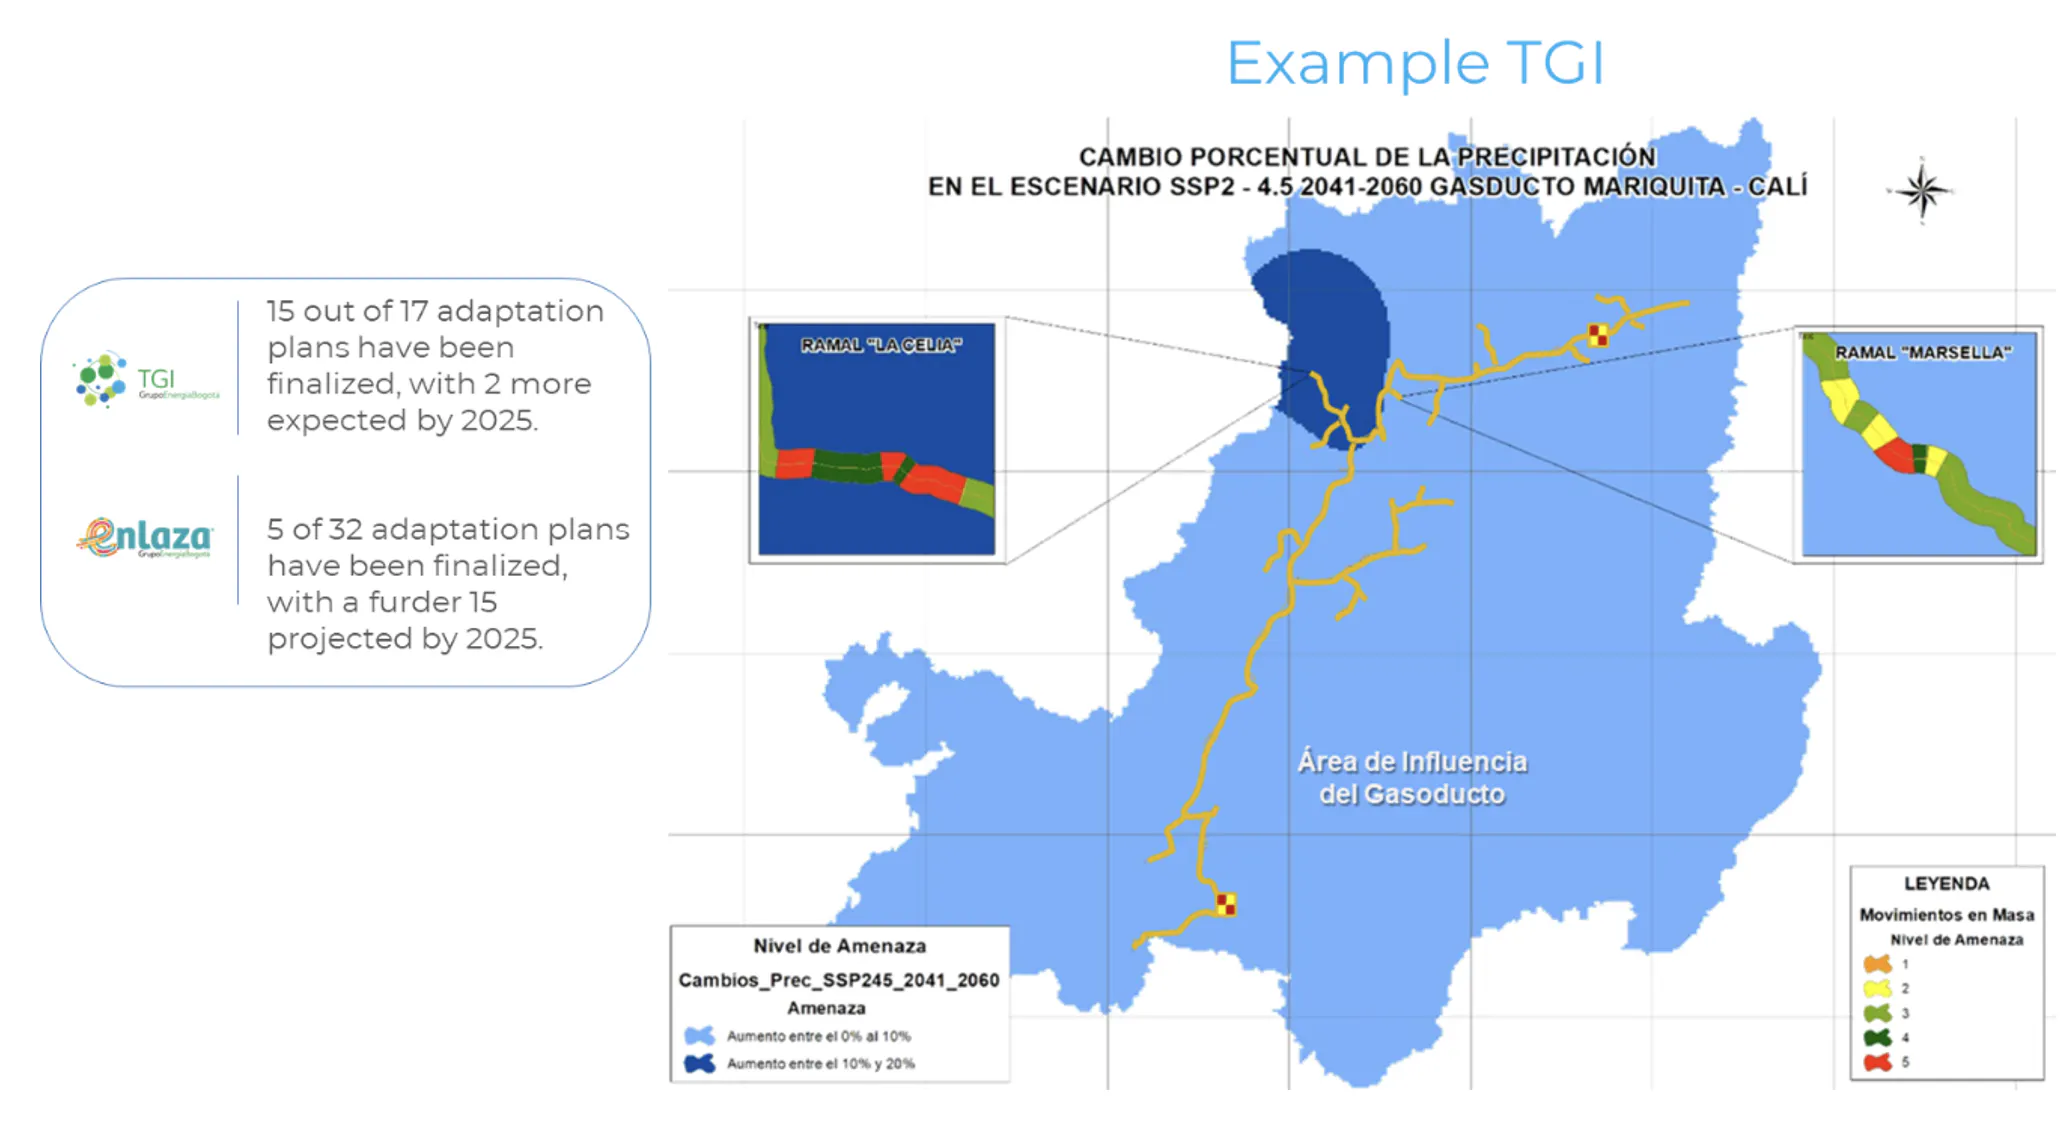
The main adaptation initiatives identified are:
Flooding: Implementation of pumping systems, changes in flood elevations and drainage to prevent and control flood risk.
Mass removal: Periodic inspection and preventive maintenance of infrastructure in risk areas, and geotechnical works.
Forest fires: Firebreaks and specialised equipment for fire prevention and suppression.
Heat waves: Maintenance and reinforcement of ventilation and air conditioning systems to ensure continuous operation.
Droughts: Installation of rainwater collection and storage systems to ensure a water supply.
Windstorms: Reinforcing structures, foundations and transmission lines to improve resilience to high winds.
Thunderstorms: Installation of surge and lightning protection systems.
Cross-cutting measure: Institutional coordination between territorial levels to integrate climate change adaptation into energy sector planning and risk management.
Conservation and restoration of strategic ecosystems within the operational area.
GEB contributes to the diversification of the energy matrix and to increasing the resilience of the electricity systems of the countries in which it operates, facilitating the transmission of clean energy, the growth of sustainable mobility, energy efficiency, the use of solar and wind energy and the incorporation of new energy sources, such as hydrogen.
Investments in energy transition 2025:
| Enlaza | TGI | Calidda | Contugas | Electrodunas | Cantalloc | Conecta | Bussiness Group | |
| Energy Transition | 2025 | 2025 | 2025 | 2025 | 2025 | 2025 | 2025 | 2025 |
| Investments in Energy Transition (COP Million | $1.055.994.01 | $6.885,51 | $420.342,41 | $12.305,28 | $7.581,84 | $0 | $882,17 | $1.503.991,22 |
Investments in energy transition 2024:
Enlaza | TGI | Cálidda | Contugas | Electrodunas | Conecta | Corporate group | |
| Investments in energy transition 2024: (M COP) | $ 816.348,00 | $ 10.331,41 | $ 119.285,96 | $ 29.183,91 | $ 22.201,59 | $ 91,94 | $ 997.442,82 |
| Renewable energies for self-consumption | $ - | $ - | $ 165 | $ - | $ 215 | $ 92 | $ 472 |
| Biogas | $ - | $ 195 | $ 85 | $ - | $ - | $ - | $ 280 |
| Hydrogen | $ - | $ 118 | $ - | $ - | $ - | $ - | $ 118 |
| Wind and solar energy | $ - | $ - | $ - | $ - | $ - | $ - | $ - |
| Smart grids | $ - | $ - | $ - | $ - | $ - | $ - | $ - |
| Transmission and/or distribution infrastructure for the connection of renewable energy projects. | $ 816.348 | $ - | $ - | $ - | $ - | $ - | $ 816.348 |
| New businesses in energy transition and substitution of high-emission fossil fuels | $ - | $ 10.019 | $ - | $ - | $ 21.987 | $ - | $ 32.005 |
| New gas distribution connections (Applicable to Peru) | $ - | NA | $ 119.036 | $ 29.184 | $ - | $ - | $ 148.219 |
| Total business investment in CAPEX | $ 818.088,00 | $ 185.605,47 | $ 467.781,83 | $ 30.303,57 | $ 31.204,04 | $ - | $ 1.532.982,91 |
| Share of GEB investment in energy transition (%) | 100% | 6% | 26% | 96% | 71% | 0% | 65% |
Sustainable Revenues (COP)
| Project | 2021 | 2022 | 2023 | 2024 | 2025 |
| Ingresos UPME 05-2009 - Subestacion Quimbo 230 kV (Tesalia) | 46.026.691.348 | 53.913.642.903 | 57.393.657.210 | 58.790.912.895 | 59.281.131 |
| Ingresos UPME 03-2010 - Subestación Chivor II 230 kV y Norte 230 kV | 22.781.688.756 | 26.431.999.300 | 28.102.222.439 | 29.017.839.744 | 29.279.118.774 |
| Ingresos UPME 01-2013- Sogamoso 500 kV | 86.068.685.783 | 100.357.771.632 | 106.746.547.210 | 109.792.192.607 | 110.749.361.440 |
| Ingresos UPME 04-2014 - Refuerzo Suroccidental | 98.631.121.540 | 115.005.822.363 | 122.327.088.635 | 125.817.262.786 | 126.914.110.823 |
| Ingresos UPME 06-2017 Colectora | 9.636.018.719 | 103.363.457.792 | 107.142.016.949 | 108.143.237.289 | |
| Ingresos UPME 04-2018 San Juan | 5.176.977.319 | 5.619.361.786 | 5.671.993.655 | ||
| Ingresos UPME 10-2019 Bonda | 444.546.458 | 5.742.503.333 | 5.796.168.245 | ||
| Ingresos UPME STR 13-2015 La Loma | 24.742.646.687 | 30.865.717.418 | |||
| Latam Solar – Conexión Enel | 2.136.383.431 | 2.597.278.588 | 2.777.567.401 | 2.920.634.452 | |
| BESS PV - Electrodunas | ND | ND | ND | ND | 587.834.886 |
| Ch Laramate - Electrodunas | ND | ND | ND | ND | 268.712.708 |
| Total | 253.508.187.427 | 307.481.638.348 | 426.151.775.651 | 469.442.304.188 | 480.478.021.491 |
Through the TCFD framework, GEB integrates climate risks into its overall risk management process in a systematic and transparent manner.
Main climate risks of the GEB
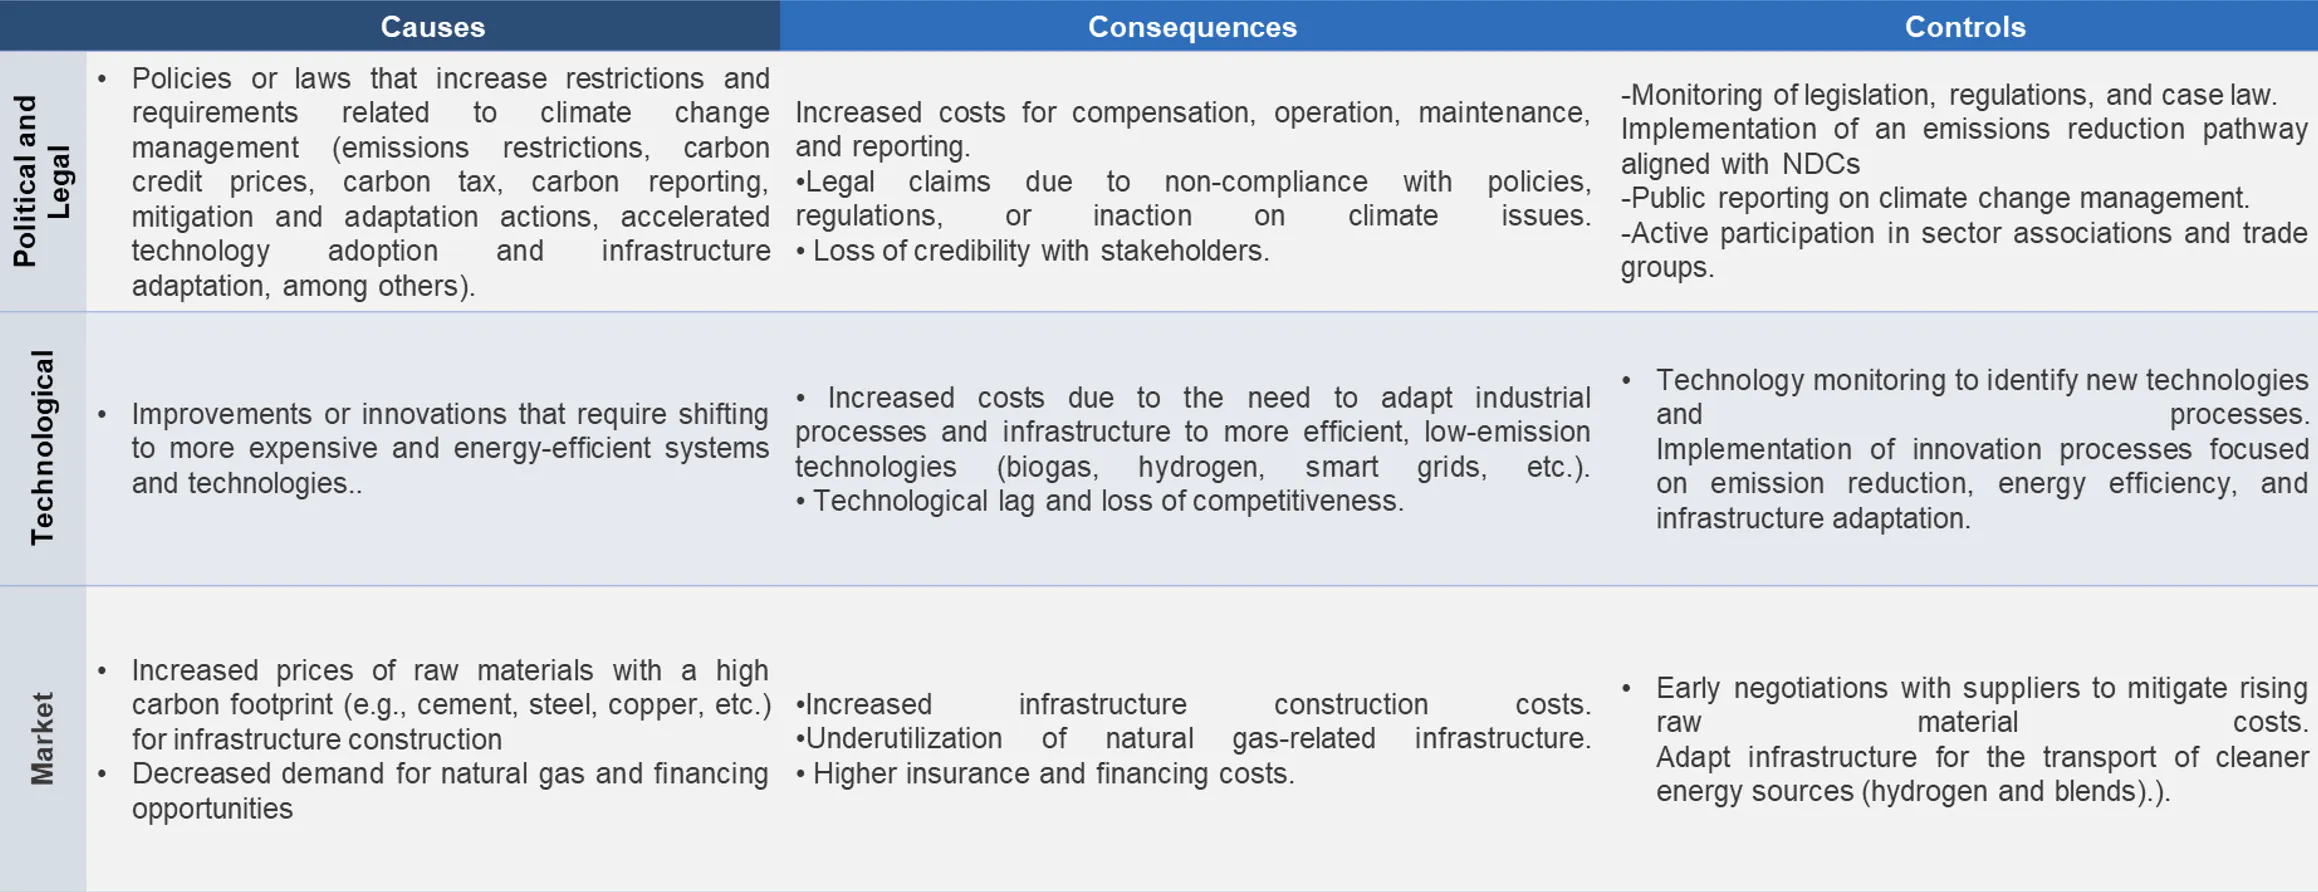
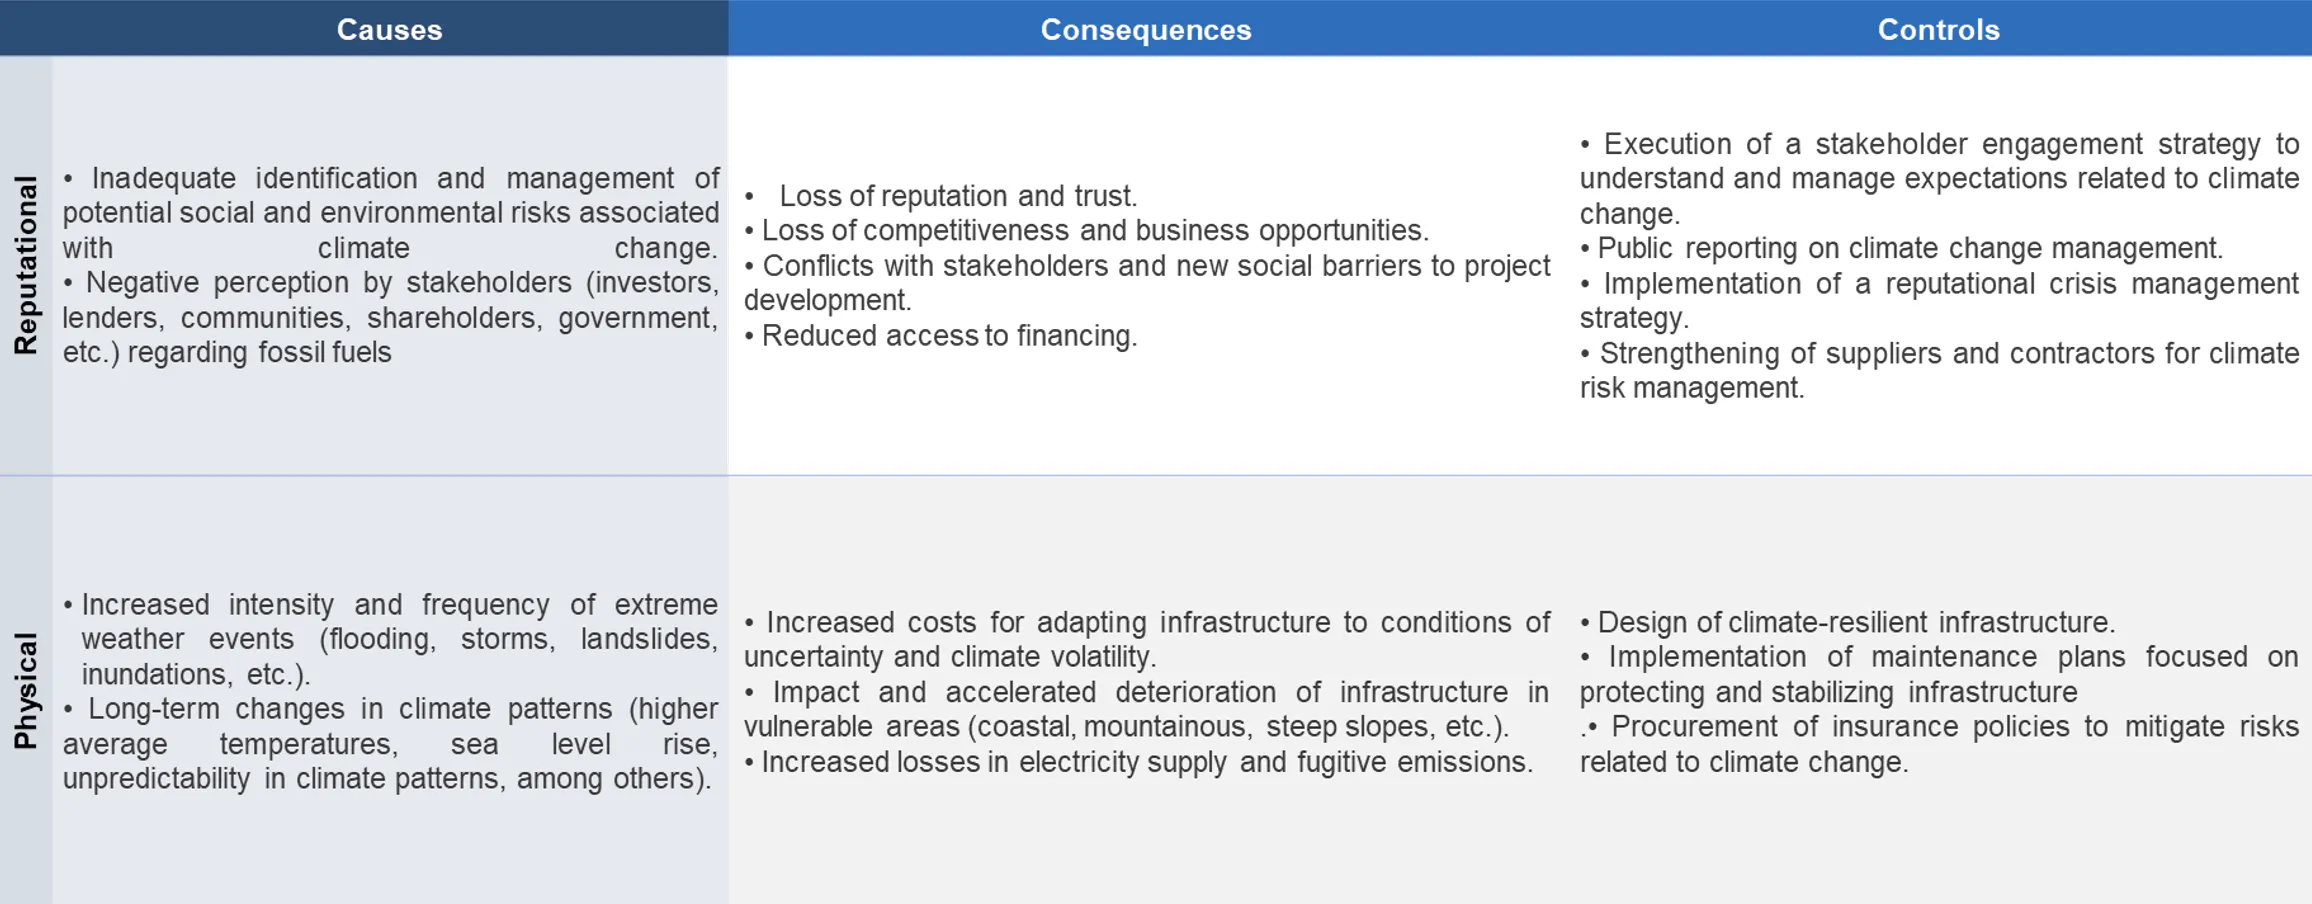
Grupo Energía Bogotá has adopted the recommendations of the Task Force on Climate-Related Financial Disclosures for the valuation and reporting of climate risks and opportunities.
Climate change management reports:
- GEB 2025 Climate Change Management Report
- GEB 2023 Climate Change Management Report
- GEB 2021 Climate Change Management Report
The document describes how GEB ensures that its participation in guilds, sector associations, and industry initiatives is consistent with its climate commitments.
GEB´s Climate Alignment 2025
View AI summary
GEB’s Climate Transition Plan sets out the Group’s roadmap to reduce its greenhouse gas (GHG) emissions by 2050, defining targets, decarbonization initiatives by subsidiary, enabling investments, and governance and reporting mechanisms.
Environmental performance